
Tricloud Nexus™ App
Nexus OEE
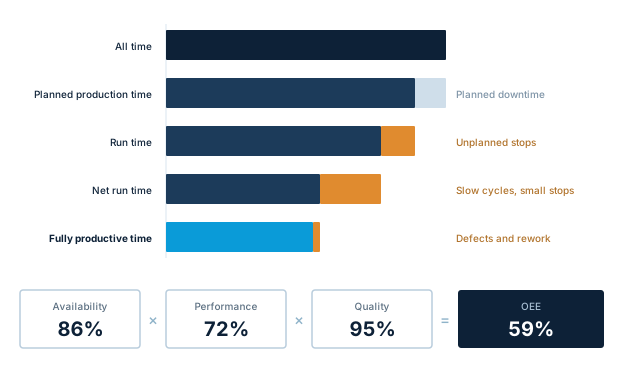
Three numbers, multiplied
OEE assesses machine efficiency through three metrics.
- Availability – measures the accessibility of the machine during scheduled operating times.
- Performance – compares the actual production speed of the machine to its optimal speed.
- Quality – evaluates the percentage of products manufactured without defects.
The three are multiplied, and that is what makes OEE unforgiving. A machine that scores a respectable 90% on all three is running at 73% overall. The graphic above shows where the rest goes: planned downtime taken out first, then unplanned stops, then slow cycles and small stops, then defects and rework. What survives all four is fully productive time.
Most people are surprised the first time they see the real number. That surprise is the value — it is capacity you are already paying for.
Why manual OEE stays wrong
If you have not measured OEE, you may be running machines at suboptimal speeds because of errors nobody has spotted. Without a numerical gauge of machine performance, the opportunity to optimise proactively simply is not visible.
- Checking machine by machine burns time – reading numbers off each machine individually spends manpower on a task that automates cleanly.
- By the time it is compiled, it is history – a number that arrives at the end of the month cannot inform a decision during the shift.
- Manual capture drifts – stop reasons written down after the fact are guesses, and the small stops never get recorded at all.
- You cannot compare – without a consistent definition across machines and sites, one line's 70% and another's 70% do not mean the same thing.
Machine, line, factory
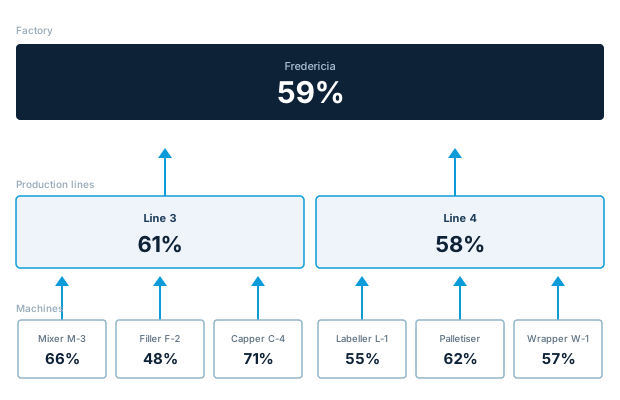
The application computes OEE for individual machines, for specific production lines and for the entire factory. Because it all derives from the same collected data and the same asset model, the numbers roll up rather than being reconciled.
That matters in practice. A line at 61% tells a plant manager where to look. The machine at 48% inside it tells a shift leader what to do. Both are the same measurement, so the conversation between them does not start with an argument about whose figure is right.
A number is only useful if it points somewhere
Visualization tools give a clear overview of machine performance, so you can monitor operations and spot deviations from expected reliability. The application lets you track performance closely and compare it against expectations or against historical data. Significant drops or persistently low numbers indicate a problem and prompt corrective action.
- See the reasons, not just the score – downtime broken down by cause, so the biggest loss is obvious rather than inferred.
- Compare like with like – shift against shift, product against product, this month against last.
- Catch drift early – a machine sliding from 70% to 62% over six weeks is invisible day to day and unmistakable in a trend.
- Raise the work that follows – trigger a service task from an event in the platform, so a finding becomes a job rather than a note. verify
- Ask follow-up questions – with Nexus AI Insights, ask why a number moved and get the analysis back in plain language.
Included in Nexus OEE
- The OEE application – deployed from the Module & Application Store to one edge device or to many, in an automated workflow.
- Data collectors – configurable modules for the equipment and protocols you already run.
- Floor dashboards – built for people standing at the machine, not sitting at a desk.
- Historical analysis – every figure retained in the platform's time series store for trend and comparison work.
- A consistent definition – one calculation applied across machines, lines and sites.
- Central operation – deployment, monitoring, diagnostics and updates handled from the Nexus Management Portal like any other Nexus application.