Skip to main content Skip to footer

Tricloud Nexus™ App

AI-Insights

You already collect the data. Getting answers out of it is the hard part.

Most manufacturers have solved data collection. What they have not solved is the distance between a question and an answer.

  • The question arrives before the dashboard does – nobody built a report for "why was Tuesday night bad on line 3", because nobody knew to ask until Tuesday night was bad.
  • The tools need a specialist – querying a historian or writing KQL is a skill most of the people with the questions do not have, and should not need.
  • The answer sits across several systems – downtime in one place, quality in another, energy in a third, order data in a fourth.
  • The knowledge is in people's heads – experienced operators know which machine misbehaves in humid weather. New colleagues have to learn it the slow way.

The result is a queue. Questions wait for someone with the right access, the right tool and the right afternoon.

Plain language in. Grounded answers out.

Nexus AI Insights works in four steps, and each one is inspectable.

  1. You ask a question – in the language you normally work in, from the Nexus Management Portal.
  2. It discovers the relevant data – the assistant browses your asset model through the i3X interface to find which machines, lines, sites, orders and measurements the question actually refers to.
  3. It reads and analyses – it retrieves the time series, event and context data it needs, and computes the answer over your real records.
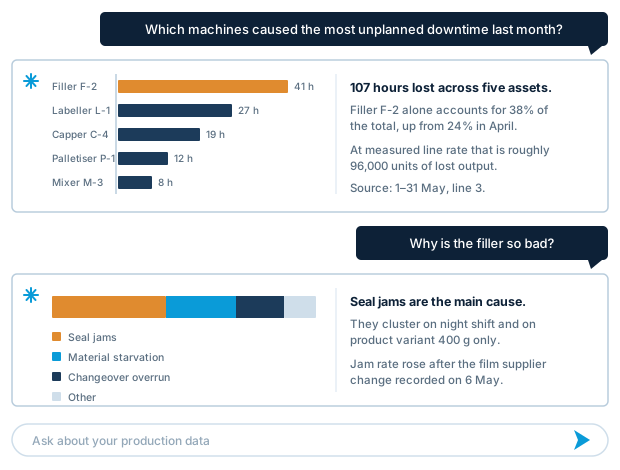
  4. It answers with evidence – a written explanation, the numbers, and a chart. Alongside it, the assets and time ranges it used, so you can check the work.
What people actually ask it
Real questions from the production floor, the maintenance office and the management meeting.

Production and downtime

  • Why did OEE drop on line 3 last week?
  • Which five machines caused the most unplanned downtime last month, and what were the top stop reasons for each?
  • Show me downtime on the filler split by shift for the last 30 days.
  • Did changeover time on line 2 actually improve after we changed the procedure in April?
  • How much production did we lose to waiting for materials versus mechanical faults this quarter?
  • What was different about the best-performing shift last month?

What the answer looks like: a ranked breakdown with the stop reasons, a bar chart by machine or shift, and the total lost production hours converted to units where order data is available.

  • Which product variants had the highest scrap rate in Q2?
  • Show me every batch where sealing temperature went outside spec last week.
  • Is there any relationship between scrap on line 1 and ambient humidity?
  • How many units did vision inspection reject yesterday, and which defect types dominated?
  • Has first-pass yield on product X drifted over the last six months?

What the answer looks like: the affected batches or orders listed by identifier, a trend or correlation chart, and the parameter values at the moment things went out of spec.

  • Which assets show rising vibration compared to 90 days ago?
  • List everything that has run more than 4,000 hours since its last service.
  • Has pump P-204 shown this vibration signature before a previous failure?
  • Which machines fail most often on night shift but not on day shift?
  • What changed on line 4 in the hour before the stop at 02:14 last night?

What the answer looks like: the assets ranked by change, the signal history charted against the earlier period, and the surrounding events in the minutes before a failure.

  • What did we spend on energy per produced unit on line 3 in June compared to May?
  • Which machines consume the most while idle over the weekend?
  • How much of last month's electricity was used outside production hours?
  • Which of our lines has the worst energy cost per unit for the same product?

What the answer looks like: consumption normalised per unit or per order, charted against production output, with the idle-versus-running split separated out.

  • What is the realistic capacity of line 2, based on six months of actual cycle times rather than the nameplate figure?
  • Which orders last week ran furthest over their standard time, and what happened during them?
  • If we move product Y to line 4, what does historical performance suggest we should expect?

What the answer looks like: actual measured cycle times distributed against standard, with the outlier orders identified and their downtime and quality events attached.

  • Compare OEE for the same machine type across our three sites for last quarter.
  • Which site gets the best first-pass yield on product X, and what do they do differently?
  • Are we seeing the same failure mode on this asset type at more than one site?

What the answer looks like: a like-for-like comparison across sites using the same asset model, with the differences in setup, recipe or utilisation called out where the data shows them.

Why this works: an open, AI-ready interface to your factory

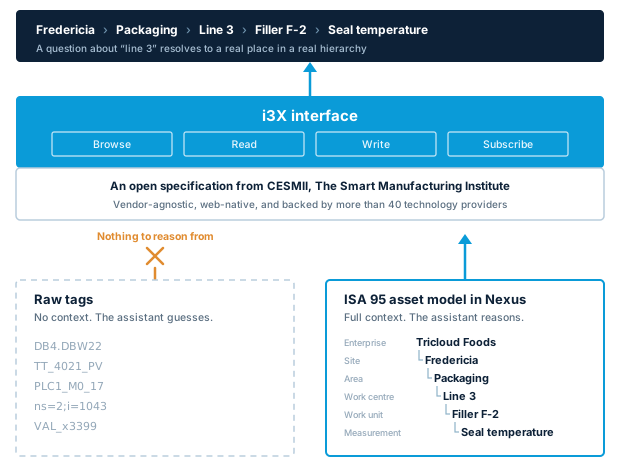
An AI assistant is only as good as its access to context. Pointed at a list of raw tag names, it guesses. Pointed at a properly structured model of your plant, it reasons.

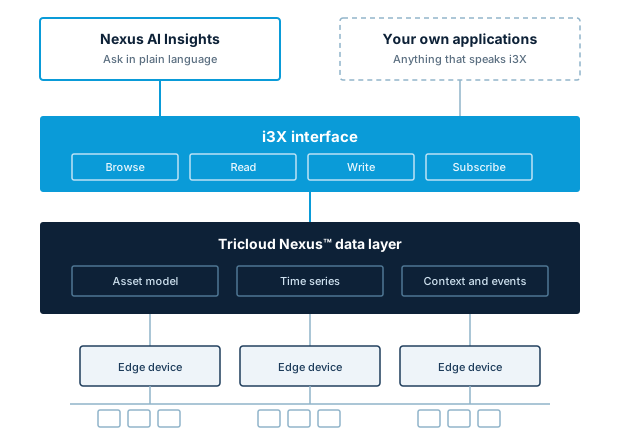
That is what the i3X interface in Tricloud Nexus provides. i3X — the Industrial Information Interoperability eXchange — is an open specification from CESMII, The Smart Manufacturing Institute, developed with a working group of manufacturers and technology providers and released as version 1.0 in 2026. It defines a vendor-agnostic, web-native way to browse, read, write and subscribe to contextualised manufacturing data.

We have implemented i3X in Tricloud Nexus and built AI Insights on top of it. Three things follow from that:

  • The assistant can discover your plant for itself – i3X is strongly typed and discoverable, so the assistant browses your asset hierarchy, understands what each measurement is, and works out which data answers the question. No question-by-question integration work.
  • It is contextualised data, not loose tags – the asset model you build in Nexus, aligned to ISA 95, is what the assistant reasons over. A question about "line 3" resolves to a real place in a real hierarchy.
  • The same interface is open to your own tools – because i3X is a standard rather than our own private API, anything that speaks i3X can read from Nexus. Your own applications, analytics tools and AI agents get the same structured access.

CESMII designed i3X in large part to make industrial AI scalable across heterogeneous plants. AI Insights is that intent, delivered.

 

How you know the answer is real

An assistant that sounds confident and is quietly wrong is worse than no assistant at all. AI Insights is built so you can check it.

  • Answers come from your data, not from the model's general knowledge – every figure is computed from records in your platform.
  • The working is shown – each answer names the assets, measurements and time ranges it used, so you can reproduce it.
  • It says when it cannot answer – if the data needed is not collected, or the period is not covered, it tells you that instead of estimating.
  • It respects your access model – answers are bounded by the same role-based permissions as the rest of the platform, through Microsoft Entra. People see what they are entitled to see.
  • Your data stays in your environment – AI Insights runs within your Nexus deployment in Azure.